Global HR Articles Center
Feature: Dashboard
Purpose:
- To provide a visual overview of important Attendance/HR/Payroll data in a customizable and user-friendly format
- To enable users to personalize their Dashboard experience for efficient information access
Key Points:
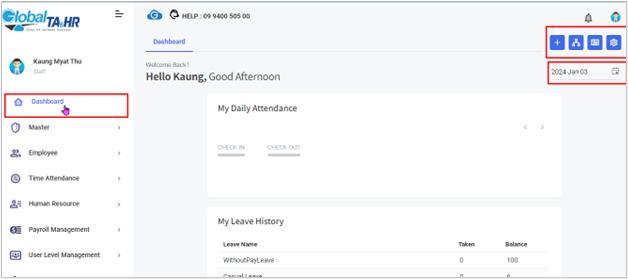
- Dashboard is the first page users see after logging in
- Gadgets display data graphically for easy interpretation
- Dashboard can be customized with multiple pages, layouts, and gadgets
- Data can be filtered by organizational structure and date range
Step-by-Step Instructions:
Accessing the Dashboard:
- Log in to the Global HR Cloud web software
- Select “ Dashboard” in the left menu panel
Dashboard Configuration:
- Adding Dashboard Pages:
- Click the “ Configuration icon”
- Enter a name for the new page
- Click “ ADD”
Changing View Layout:
- Click the “ Layout icon”
- Choose a layout from the options
Organizational Structure:
- Click the “ Organization Structure” icon
- Select the desired department or company
- Click “ Refresh” icon
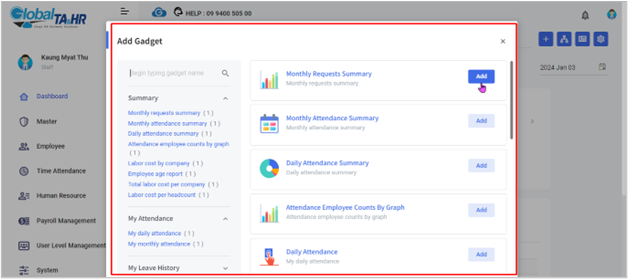
Using and Removing Gadgets:
Adding Gadgets:
- Click “ + Add Gadget icon” or “ Add Gadget”
- Select a gadget and click “ Add”
Removing Gadgets:
- Click the “ Delete icon” in the top right corner of the gadget
Available Gadgets:
Summary: (View overall summaries and trends)
- Monthly Requests Summary
- Monthly Attendance Summary
- Daily Attendance Summary
- Attendance Employee Counts by Graph
- Labor Cost by Company
- Employee Age Report
- Total Labor Cost per Company
- Labor Cost per Headcount
My Attendance: (View personal attendance information)
- My Daily Attendance
- My Monthly Attendance
- My Leave History
Team: (View team-related information)
- My Team
- Leave Requested by Teammates
- Tasks Status Count
- Manpower List
News: (View announcements and updates)
- Teammates’ Birthdays
- Upcoming Holidays
- Monthly Announcements
- Permanent Employee List
Specifying Dashboard Date:
- Click “ Date” to select a specific date range for data display
Additional Information:
- Watch the sample video for a visual demonstration: [Dashboard Setup Link]
- Experiment with different layouts and gadgets to find the most informative and useful setup for your needs
- Regularly review and update your Dashboard configuration to ensure it aligns with your current priorities
Screenshots: